Home > Reports > Race Readiness Graph
Race Readiness Graph
The Race Readiness graph is KOM Informatic's take on a TRIMP derived system for measuring 3 different areas which can be seen as having an impact on your performance as a cyclist. TRIMP stands for TRaining IMPulse, a system develped by distance runner Roger Bannister for quantifying training loads. These areas are:
- Fitness - A rolling average of the Training Loads you've incurred over the long term in your training rides
- Fatigue - A rolling average of the Training Loads you've incurred over the short term in your training rides.
- Form - The difference between Fitness and Fatigue.
Provided you've trained hard enough (built up Fitness) and with the right composition of training for your event, tapering your workload in the week prior to your event (building Form and lessening Fatigue) can be a great way to ensure an optimum performance for your event. Tools like this are not a panacea however as people can deliver good performances despite that the graphs might tell them they aren't in a good position to do so. It may be that other models, driven by the demands of various events can provide better predictive validity. The Race Readiness Graph is the initial screen you will see after logging in. Otherwise,
- From the main menu mouse over the {Reports} main menu selection, then click the {Race Readiness Graph} main menu selection, or click the Race Readiness Graph hyperlink on the footer.
- The graph will display.
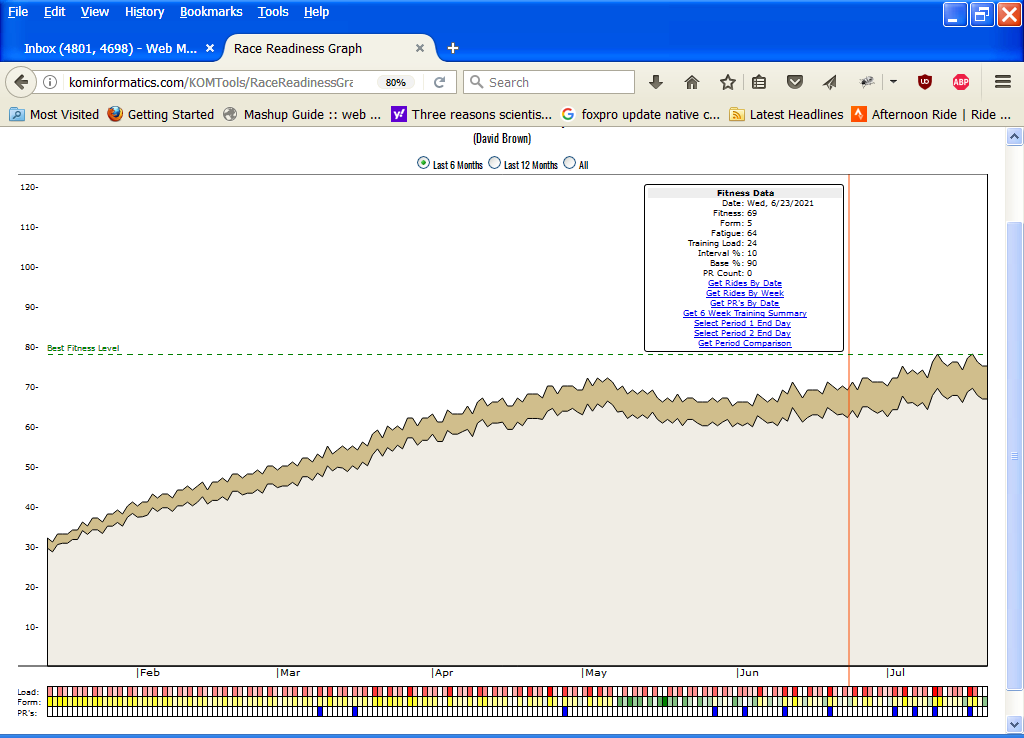
- Mousing over the graph displays an info box that shows you the Fitness, Fatigue, Form, Training Load, Interval %, Base %, and PR Count for a given day.
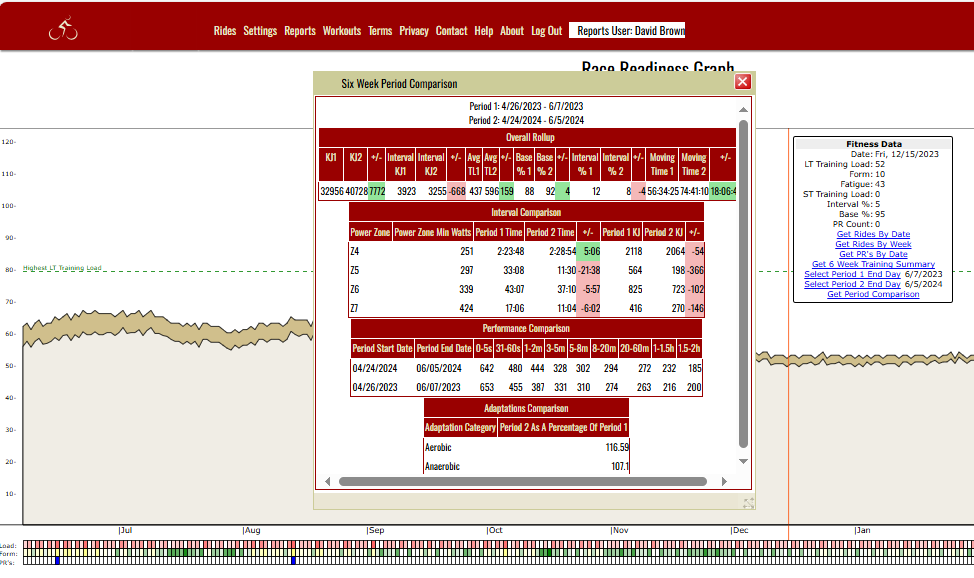
- Clicking on the graph freezes the info box and allows you to click either the Get Rides By Date, Get Rides By Week, Get PR's By Date, Get 6 Week Training Summary. Select Period 1 End Day, Select Period 2 End Day or Get Period Comparison hyperlinks found within the info box. Clicking on either of these Rides hyperlinks will display a list of rides underneath the graph. Clicking on the Get PR's By Date hyperlink will display a summary of any overall PR's achieved on that day. You'll know when this happens because the day is marked in blue on the PR's section at the bottom of the graph. Clicking on the Get 6 Week Training Summary shows a report based on the 6 weeks prior to the day you've clicked on. Clicking on either of the "Select Period" links sets the day over which the info box is positioned as either the End Day for Period 1 or 2. After selecting End Days for both periods, clicking on the Get Period Comparison link runs the 6 Week Period Comparison report.
- The graph also tracks training load on the lower part of the screen Harder days are bright red, lighter days are pinkish, and rest days are white.
- Form is tracked just beneath load. Positive form which occurs through rest days appears in green in varying shades. A darker green indicates a higher form. Negative
form accrues when you've been working hard over a short period of time accumulating a lot of fatigue. Negative form appears in yellow, with darker shades indicating a lower form and higher fatigue. Neutral form appears white.
- PR's are tracked just beneath form. If you've achieved an all time PR (power based) on that day, that days box will appear in dark blue. You can get the details on the PR(s) by clicking the graph on the desired day, freezing the Info Box, and then clicking the Get PR's By Date hyperlink in the InfoBox.
- The graph initially displays the last six months worth of data, but also will display data for the last year, or all. You accomplish this by clicking on either the [Last Six Months], [Last 12 Months] or [All] radio button options at the top of the screen.
Here's a view of the Race Readiness Graph as it's displayed initially. The top line represents fitness. The dark gold area of the graph represents that portion of your training devoted to intervals. The beige area of the graph represents your "base" or non-interval training.
Here's a view of the Race Readiness Graph with a Six Week Comparison report open:
See also